


_4_edited.jpg)

_5_edited.jpg)
_7_edited.jpg)
_10_edited.jpg)
_9_edited.jpg)
_11_edited.jpg)
_12_edited.jpg)
_13_edited.jpg)


%20.png)


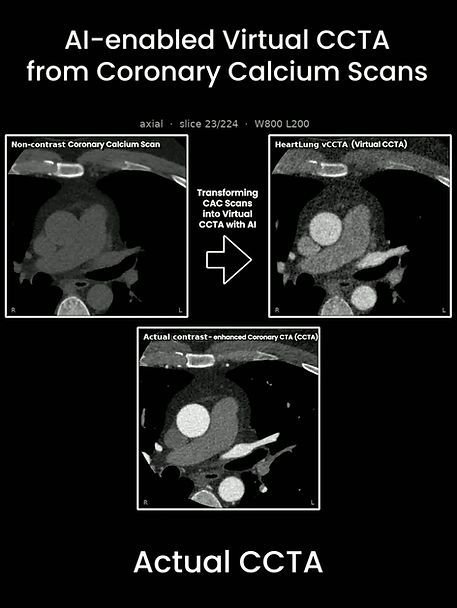


What if a routine CAC scan could reveal more than calcium?
Updated: Aug 26
ESC 2026 · 10 Scientific Presentations · Oral & Poster · 1/10
Going Beyond the Conventional Agatston Score with Agatston-2.0
Organised by: European Society of Cardiology (ESC) visual

A HeartLung.AI study within the Miami Heart Study explores how AI-driven Agatston-2.0 and cardiometabolic phenotyping can uncover signals associated with obstructive stenosis, high-risk plaque, and non-calcified plaque—all from a routine CAC scan.
Traditional CAC scoring is highly valuable for quantifying calcified coronary plaque, but it does not directly measure non-calcified plaque, high-risk plaque features, or obstructive coronary stenosis. This study investigated whether AI could extract additional information already contained within the CAC scan and use it to better identify these clinically important plaque phenotypes.
Going Beyond the Agatston Score
The study included 1,259 asymptomatic participants, ages 40–65, from the Miami Heart Study who underwent paired CAC and CCTA imaging.
HeartLung.AI's AI-CVD approach analyzed the CAC scans to derive a broad range of cardiometabolic and cardiovascular imaging biomarkers, including:
Epicardial, visceral, and skeletal muscle characteristics
Liver fat
Cardiac chamber volumes
Aortic and pulmonary artery dimensions
Coronary and thoracic aortic calcification
Pericoronary adipose tissue (PCAT) features
Additional calcium and plaque-related indices
These measurements were then evaluated against plaque phenotypes identified on CCTA, including obstructive stenosis, high-risk plaque features, and non-calcified plaque.
Key Findings
Across all three major plaque phenotypes, the comprehensive AI-CVD model outperformed models based on the traditional Agatston CAC score alone:
Obstructive stenosisAI-CVD achieved an AUC of 0.957, compared with 0.881 for Agatston CAC-only.
High-risk plaqueAI-CVD achieved an AUC of 0.789, compared with 0.626 for Agatston CAC-only.
Non-calcified plaqueAI-CVD achieved an AUC of 0.771, compared with 0.679 for Agatston CAC-only.
The differences were statistically significant across all three comparisons (p < 0.001).

Why This Matters
A CAC scan is traditionally interpreted primarily through the amount of coronary calcium it contains. But the CT images themselves contain substantially more anatomical and metabolic information.
By using AI to analyze multiple structures and tissue characteristics from the same examination, this study suggests that a routine CAC scan could potentially provide a much broader picture of cardiovascular and cardiometabolic health—including information associated with coronary disease that is not captured by the calcium score alone.
The results support a shift from viewing CAC CT as simply a calcium-scoring examination toward considering it as a richer source of imaging biomarkers for cardiovascular risk assessment.
One routine CAC scan. Multiple cardiometabolic biomarkers. A deeper view of coronary risk.
Download the full presentation below to explore the AI-CVD methodology, cardiometabolic biomarkers, comparative performance, and study findings.


Comments